
India Exports by Country: India’s total exports (merchandise + services) reached a record US$863.1 billion in FY 2025-26 (April 2025–March 2026). Merchandise exports stood at approximately US$441.8 billion, while services exports touched US$421.3 billion. This marked continued growth driven by Free Trade Agreements (FTAs), manufacturing expansion under Production-Linked Incentive (PLI) schemes, and diversification into electronics and engineering goods.
Merchandise exports remain concentrated but are gradually broadening. The top 10 destinations typically account for roughly half of goods exports.
India Exports by Country: Top Export Destinations by Country (Merchandise Exports)
United States is by far the largest market, consistently taking 19–21% of India’s goods exports (around US$85–87 billion in recent full-year data). Key items shipped to the US include smartphones and electronic goods, pharmaceuticals, engineering products, textiles/apparel, and gems & jewellery.
United Arab Emirates (UAE) ranks second (roughly 6–9% share, ~US$37 billion). It is a major hub for re-exports and a key buyer of petroleum products, gems & jewellery, engineering goods, and electronics. The India-UAE CEPA has significantly boosted trade.
Other major destinations include:
| Rank (approx.) | Country | Share / Value (recent FY/calendar) | Notes |
|---|---|---|---|
| 1 | United States | ~19–21% (~$85–87 bn) | Largest & most diversified |
| 2 | UAE | ~6–9% (~$37 bn) | Strong FTA benefits |
| 3 | Netherlands | ~3–4% | Major gateway for refined petroleum into Europe |
| 4 | China | ~4% | Growing but still relatively modest share |
| 5 | Singapore | ~2.5–5.7% | Electronics, petroleum, engineering |
| 6 | United Kingdom | ~2.7–3.1% | Boosted by new India-UK CETA |
| 7 | Bangladesh | ~2.5% | Textiles, engineering, agri products |
| 8 | Germany | ~2.4–2.6% | Engineering goods, chemicals, auto components |
| 9 | Saudi Arabia / South Africa / others | ~2–2.5% each | Petroleum, engineering, agri |
| 10 | Australia / Italy / Nepal etc. | Varies | FTA-driven growth in Australia |
Regional patterns: Asia (including West Asia) remains the largest destination region, followed by North America and Europe. Africa and Latin America are growing but still smaller. FTAs with ASEAN, UAE, Australia, UK, Japan, South Korea, and others have helped expand market access, especially for labour-intensive sectors such as textiles, leather, marine products, and gems & jewellery.
China has become India’s largest overall trading partner (exports + imports) in some recent periods due to high imports, but the US remains the clear leader for exports.
Top Products / Categories Exported from India
India’s export basket is diverse. At the broad category level (2-digit HS), the leaders in recent years have been:
- Mineral fuels / Petroleum products (refined petroleum oils, diesel, gasoline, naphtha) — historically the single largest category by value (often US$50–70+ billion), though volumes and values fluctuate with global oil prices.
- Electrical machinery & equipment (including smartphones and telecom instruments) — the fastest-growing major category.
- Machinery (including mechanical appliances and computers).
- Gems & jewellery (cut diamonds, gold jewellery, precious stones).
- Pharmaceuticals (formulations, generics, biologicals).
- Vehicles & auto components (cars, motorcycles, parts).
- Organic chemicals.
- Cereals (mainly rice — both Basmati and non-Basmati).
- Iron & steel and articles thereof.
- Textiles & apparel, marine products, engineering goods overall, etc.
Engineering goods as a combined group (machinery, electrical equipment, vehicles, etc.) often form the largest aggregated export sector.
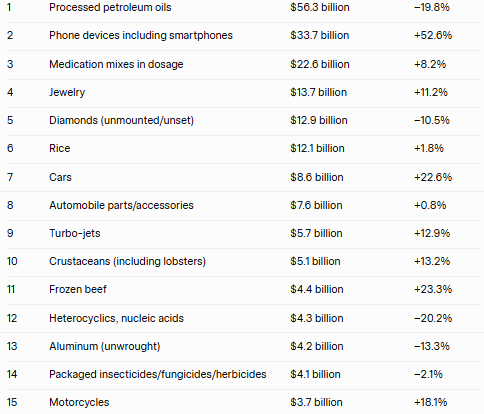
Top 50 Products Exported from India (Granular 4-digit HS level, based on 2026 data)
The following list ranks the most valuable individual product lines shipped from India in 2026 (calendar year data from World’s Top Exports / UN Comtrade-style reporting). Values are approximate and rounded; year-on-year changes are shown where available. These 100 top lines alone accounted for over 70% of merchandise export value.
| Rank | Product | Approx. Value (US$) | YoY Change |
|---|---|---|---|
| 1 | Processed petroleum oils | $56.3 billion | –19.8% |
| 2 | Phone devices including smartphones | $33.7 billion | +52.6% |
| 3 | Medication mixes in dosage | $22.6 billion | +8.2% |
| 4 | Jewelry | $13.7 billion | +11.2% |
| 5 | Diamonds (unmounted/unset) | $12.9 billion | –10.5% |
| 6 | Rice | $12.1 billion | +1.8% |
| 7 | Cars | $8.6 billion | +22.6% |
| 8 | Automobile parts/accessories | $7.6 billion | +0.8% |
| 9 | Turbo-jets | $5.7 billion | +12.9% |
| 10 | Crustaceans (including lobsters) | $5.1 billion | +13.2% |
| 11 | Frozen beef | $4.4 billion | +23.3% |
| 12 | Heterocyclics, nucleic acids | $4.3 billion | –20.2% |
| 13 | Aluminum (unwrought) | $4.2 billion | –13.3% |
| 14 | Packaged insecticides/fungicides/herbicides | $4.1 billion | –2.1% |
| 15 | Motorcycles | $3.7 billion | +18.1% |
| 16 | Yarn (85%+ cotton) | $3.2 billion | –5% |
| 17 | Women’s clothing (not knit or crochet) | $3.2 billion | +4.7% |
| 18 | Electrical converters/power units | $3.1 billion | +3.2% |
| 19 | Rubber tires (new) | $3.1 billion | +3.1% |
| 20 | Taps, valves, similar appliances | $2.8 billion | +16.2% |
| 21 | Insulated wire/cable | $2.8 billion | +25.5% |
| 22 | Iron ferroalloys | $2.7 billion | +2.9% |
| 23 | T-shirts, vests (knit or crochet) | $2.4 billion | +4.9% |
| 24 | Transmission shafts, gears, clutches | $2.3 billion | +7.3% |
| 25 | Synthetic organic coloring | $2.3 billion | –5.1% |
| 26 | Blood fractions (including antisera) | $2.2 billion | +37.4% |
| 27 | Unglazed ceramic flags, tiles, cubes | $2.2 billion | +0.4% |
| 28 | Sugar (cane or beet) | $2.1 billion | –5.5% |
| 29 | Linens | $2.1 billion | +2.3% |
| 30 | Iron ores, concentrates | $1.8 billion | –33.3% |
| 31 | Miscellaneous iron and steel structures | $1.8 billion | +1.3% |
| 32 | Miscellaneous furnishings | $1.8 billion | –9.6% |
| 33 | Piston engine parts | $1.8 billion | +9.4% |
| 34 | Footwear (leather) | $1.7 billion | –3.5% |
| 35 | Aluminum oxide/hydroxide | $1.7 billion | +55.7% |
| 36 | Heavy machinery (bulldozers, excavators, etc.) | $1.7 billion | +22.7% |
| 37 | Cruise/cargo ships, barges | $1.7 billion | –38.5% |
| 38 | Cases, handbags, wallets | $1.6 billion | +2.6% |
| 39 | Liquid pumps and elevators | $1.6 billion | +7.2% |
| 40 | Electric circuit parts, fuses, switches | $1.6 billion | +28.6% |
| 41 | Trucks | $1.6 billion | +10.6% |
| 42 | Aircraft or spacecraft parts | $1.5 billion | +10.2% |
| 43 | Electro-medical equipment (e.g. X-rays) | $1.5 billion | +5.9% |
| 44 | Machinery parts | $1.5 billion | +5.6% |
| 45 | Air or vacuum pumps | $1.5 billion | +3.1% |
| 46 | Lower-voltage switches, fuses | $1.5 billion | +13.6% |
| 47 | Engines (diesel) | $1.4 billion | +11.1% |
| 48 | Solar power diodes/semi-conductors | $1.4 billion | –20.5% |
| 49 | Pepper (dried/crushed/ground) | $1.4 billion | –0.9% |
| 50 | Unmanufactured tobacco, tobacco waste | $1.4 billion | +1.2% |
Notable trends:
- Smartphones have surged dramatically (now often the second-largest single product line), thanks to PLI schemes and global supply-chain shifts.
- Pharmaceuticals remain a high-value, high-surplus category (India is a major global supplier of generics).
- Petroleum products still dominate absolute value but are sensitive to crude prices and refining margins.
- Rice, marine products (shrimp/crustaceans), buffalo meat, and cotton textiles continue as important traditional strengths.
- Engineering and auto-related items (cars, parts, motorcycles, machinery) show steady growth.
Key Drivers and Outlook
- FTAs with UAE, Australia, UK, ASEAN, and others have expanded market access and diversified the export basket.
- Electronics and engineering are the fastest-growing engines.
- Services (IT, business process management, professional services) now almost match merchandise in value and provide a large trade surplus.
- Challenges include concentration risk (heavy reliance on the US), global protectionism, logistics costs, and the need for further diversification into Africa, Latin America, and newer Asian markets.
Data sources primarily include India’s Ministry of Commerce & Industry (DGCIS / TradeStat), World’s Top Exports, OEC, and government press releases for FY 2025-26 and calendar 2025. Exact rankings and values shift slightly between provisional monthly figures and final annual data, and between calendar vs financial year reporting. For the most precise current numbers, refer to the official TradeStat portal of the Department of Commerce.